Country Overview
*All data is in tonnes per annum
TEXTILE WASTE*
15,400,000
Post consumer textile waste
15,400,000
Cotton
50.5%
Polyester
27.9%
Viscose
9.4%
Nylon
3.4%
Acrylic
2.5%
Wool
1.4%
Silk
0.5%
Acetate
0.35%
Elastane
0.35%
Undefined
3.7%
pre consumer textile waste
Post Industrial textile waste
Cotton
Polyester
Viscose
Nylon
Acrylic
Wool
Silk
Acetate
Elastane
Undefined
Imported textile waste
Cotton
Polyester
Viscose
Nylon
Acrylic
Wool
Silk
Acetate
Elastane
Undefined
*This data is from Sorting for Circularity USA
KEY POINTS ON Textiles & Apparels LANDSCAPE
USA Apparel Imports Dominated by Asia
$79.3B
Apparel Imports (2023)
USA is the largest single country importer of apparel in the world, with the majority of imports coming from Asian countries such as Bangladesh, Cambodia, India, Indonesia, and Pakistan. Local manufacturing has significantly decreased over the past decades due to factors such as automation and import competition.

Major Cotton Producer but Import-Dependent Downstream Manufacturing
14.41M Bales
Cotton Production (2024-25)
The USA is the fourth largest cotton producer, contributing 12% to the global cotton production. The main export markets for US fibres, yarns and fabrics are Mexico, Canada & Honduras. Its fabric and apparel manufacturers use the largest percentage of imported components (18%), whereas the least is used by its fibre and yarn industry (11%).
Offshoring Persists as USA Apparel Firms Remain Small-Scale
76%
U.S Apparel Mills are Micro-Enterprises
The USA T&A industry has limited vertical integration, with one-third of the industry showing production of more than one product type (e.g., yarn or fabric). Apparel factories tend to be small and are concentrated in regional clusters. Domestic apparel output is growing modestly, but much of its manufacturing has moved offshore.
Most USA Textile Waste Ends Up in Landfills
85%
Textile Waste is Landfilled
Although the USA produces significant textile waste annually, 85% ends up in landfills or incinerated. While 60% of consumers donate or resell textiles, 40% discard them, often due to quality or convenience concerns. Limited recycling infrastructure for post-consumer textiles hinders progress toward a circular economy.
waste cost
waste Type
composition
price
notes
No data available
Other Notes
- Some states within the USA regulate advanced recycling as a waste management activity, while others regulate it as a manufacturing activity. This impacts sitting, permitting and reporting requirements mandated by the states.
- States regulating ART as solid waste - New York, Pennsylvania, Virginia, California
- States regulating ART as manufacturing - Alaska, Texas, Ohio, Massachusetts, North & South Dakota
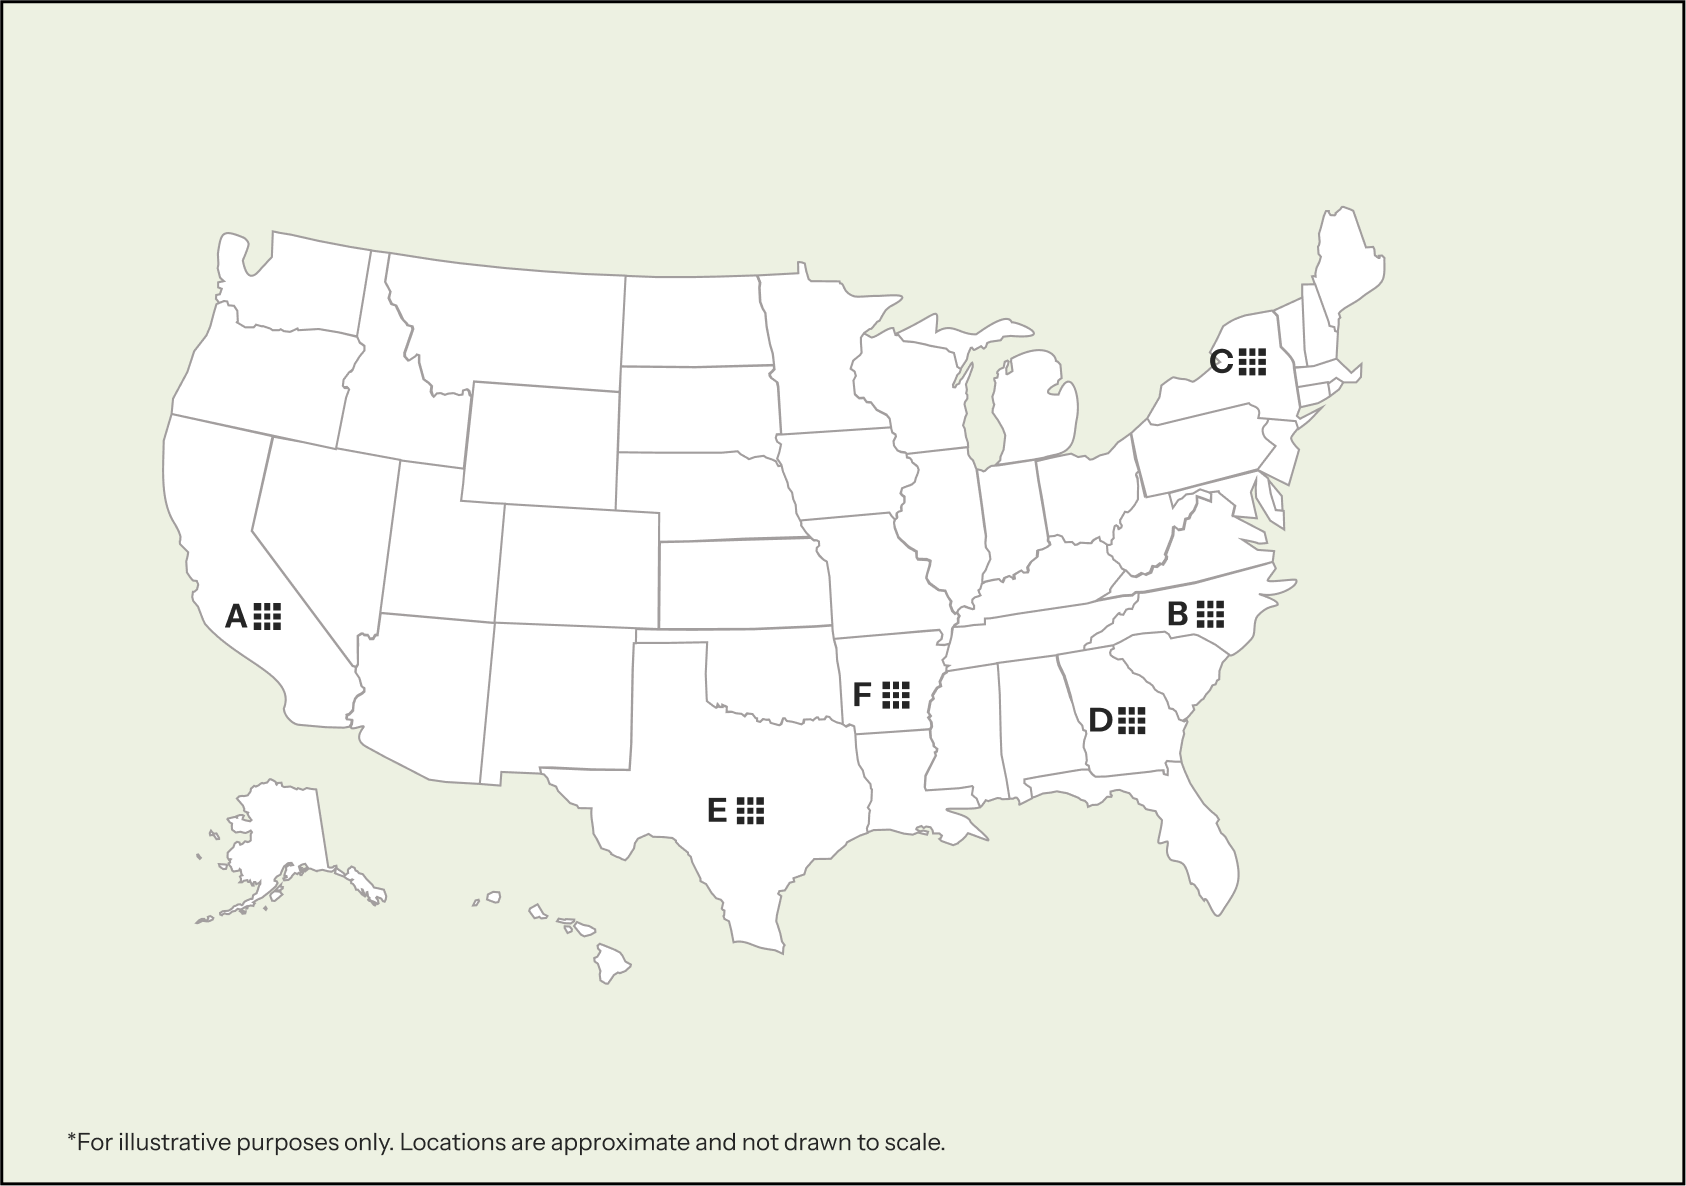
production clusters
Key regions with fibre production
California(A), North Carolina(B), New York(C), Georgia(D), Texas(E), Arkansas(F)
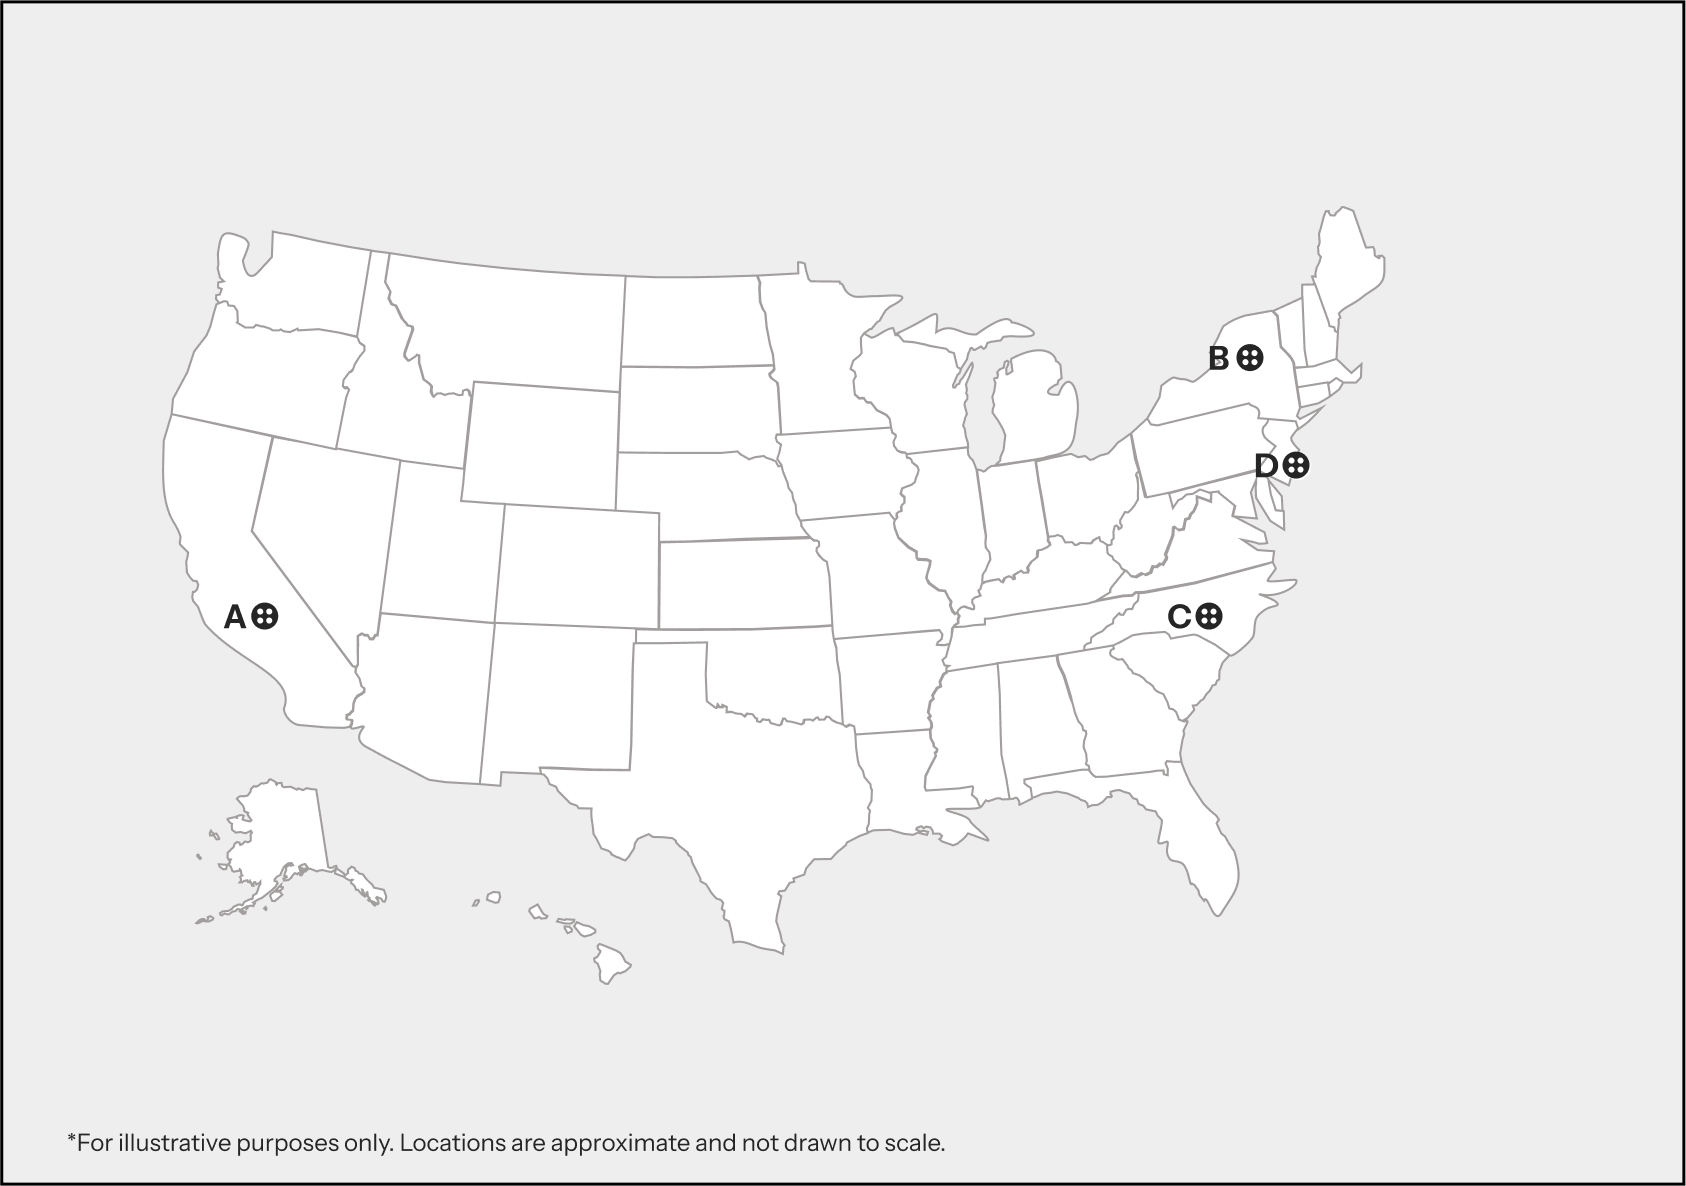
Key regions with apparel production
California(A), New York(B), North Carolina(C), New Jersey(D)
Other Notes
- Major players in apparel manufacturing include V.F. Corporation, Kontoor Brands, Inc., Hanesbrands Inc. and fibre producers like INVISTA, Wellman Inc., and The Hurd Co.
Waste regulation
California Responsible Textile Recovery Act of 2024
It is the first USA Extended Producer Responsibility program for apparel and textiles, requiring producers to manage collection, reuse, and recycling through approved organizations, launching in 2028 with full compliance by 2030. The law aims to cut textile waste and promote a circular economy in California, placing a shared responsibility for end-of-life product management on the producers and other entities involved in a product’s value chain.
California’s Recycling Market Development Zone (RMDZ) program
It offers low-interest loans, technical assistance, and free product marketing to businesses that use materials from the waste stream to manufacture their products and are based in a designated zones.
New York Textile Reuse & Recycling Act (S3217)
Introduced in 2025 and under-review, would require textile producers to fund and operate a statewide program for the collection, reuse, recycling, or proper disposal of textiles. Producers must submit plans by Dec 31, 2026, ensure free and convenient drop-off sites, and cover program costs starting July 1, 2027, with oversight by the State’s Department of Environmental Conservation.
Massachusetts Textile Waste Ban (2025):
Prohibits disposal of most textiles (includes clothing, footwear, bedding, curtains, fabric, and scraps of all sizes that are clean and dry) in landfills or incinerators, requiring businesses and residents to route unwanted clothing/textiles to reuse or recycling.
Waste trade
15.25 kT
Import quantities (HS 6309)
673.73 kT
Export quantities (HS 6309)
Other Notes
- Sorting is mostly offshored (Mexico, Caribbean, South Asia), and the domestic ones are either small-scale or limited in scope. Sorting and grading are concentrated along the Mexico/Texas border, as well as in southern Florida and the Carolinas
green energy
10.9%
Share of modern renewables in final energy consumption
Other Notes
- Renewable electricity generation by sources - Wind (45.7%), Hydro (28.9%), Solar (23 %) & Geothermal (2.1%)
- Clean Energy Production Tax Credit (Section 45Y): It gives a 10-year federal tax credit for new electricity-generating facilities that produce zero greenhouse gas emissions, starting January 1, 2025; eligible projects earn upto $0.15/kWh if wage, apprenticeship, and domestic content requirements are met.
- Clean Energy Investment Tax Credit (Section 48E: Let's investors claim a federal tax credit for a portion of the cost of building qualifying clean electricity or energy storage facilities, and is also technology-neutral and emission-based as of 2025
- Bipartisan Infrastructure Law (2021): It is a $1.2 trillion USA investment to modernise infrastructure, with $73 billion dedicated to clean energy transmission, grid upgrades, hydrogen hubs, EV charging, and renewable innovation. It aims to build a resilient, 100% clean energy grid by 2035 and support a net-zero emissions economy by 2050.

