Canada
download summary
Country Overview
*All data is in tonnes per annum
TEXTILE WASTE*
1,139,972
Post consumer textile waste
480,576
Natural Fibres
38.92%
Synthetic fibres
26.54%
Natural & Synthetic Blends
34.54%
pre consumer textile waste
Post Industrial textile waste
Natural Fibres
Synthetic fibres
Natural & Synthetic Blends
Imported textile waste
Natural Fibres
Synthetic fibres
Natural & Synthetic Blends
*This data is from A Feasibility Study of Textile Recycling in Canada: Dumpster Dive
KEY POINTS ON Textiles & Apparels LANDSCAPE
Import-heavy Apparel Market with Niche Export Focus
95%
Apparel Sold in Canada was imported (2020)
Canada’s apparel market is heavily import-dependent, with annual imports totaling around $12 billion, primarily sourced from China, Bangladesh, Cambodia, and Vietnam. Sourcing from the EU is gradually increasing, supported by the EU-Canada Free Trade Agreement (CETA). Domestic production, valued at approximately $2.4 billion, has declined over time and now focuses on high-value segments

Heavy Reliance on Imported Synthetic Yarn and Fabric
CA$596 million
Synthetic, Artificial Yarn and Fabric Import (2017)
The industry is highly dependent on textile imports, with synthetic and artificial yarns and fabrics being the largest imported categories. Canada is also a net importer of cotton (HS2 52). The domestic market shows strong demand for both synthetic fibres, such as polyester and nylon, and natural fibres, including cotton and wool, for textile production.
Focus on High-End and Value-Added Products
800
Textile Industry Companies and Mostly SMEs.(2020)
Canadian textile industry is SME driven. While domestic manufacturers are losing market share to foreign competitors, Canadian apparel producers have pivoted towards high-end, value-added designer and handcrafted fashion. Many have relocated production to low-cost countries, while retaining key activities such as research, design, merchandising, and marketing within Canada.
High Synthetic Textiles Disposal and Limited Recycling
290 kT
Synthetic Textiles Discarded
In 2020, Canadians discarded huge amount of synthetic textiles, making textiles the fifth-largest category of plastic waste by volume. Only a small fraction is recycled, with the majority ending up in landfills or being exported. Most recycling currently involves downcycling into rags or insulation, while fiber-to-fiber recycling remains limited due to technical and infrastructural challenges
waste cost
waste Type
composition
price
notes
No data available
Other Notes
- The IC&I sector (industrial, commercial, and institutional) generates substantial pre-consumer textile waste (often cleaner and more readily recyclable), while post-consumer waste from households is less tracked and more variable in quality and composition
- Most municipalities lack formal textile diversion programs. Collection is mainly conducted by charities, who resell items locally or pass them to graders for the global second-hand market. Textile waste tracking as a standalone category is rare, creating significant data gaps
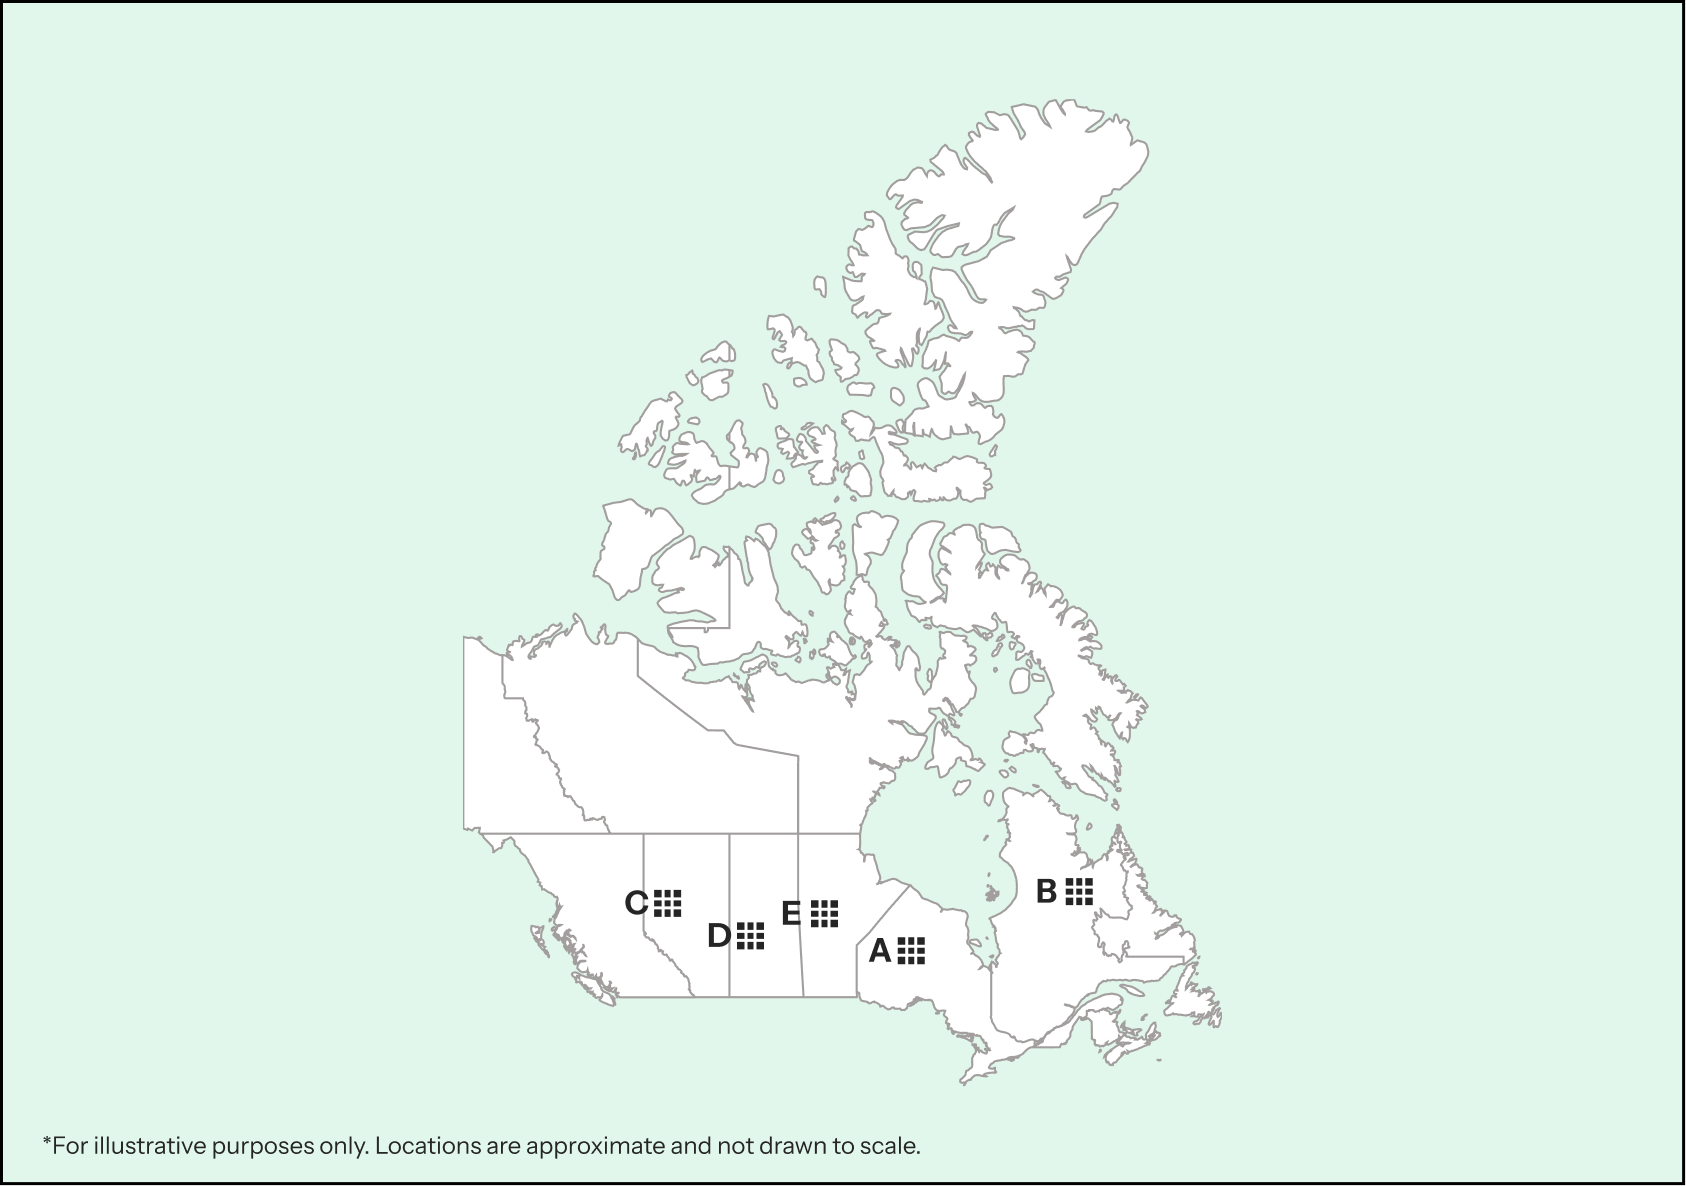
production clusters
Key regions with fibre production
Ontario(A), Quebec(B), Alberta (C), Saskatchewan (D), Manitoba (E)
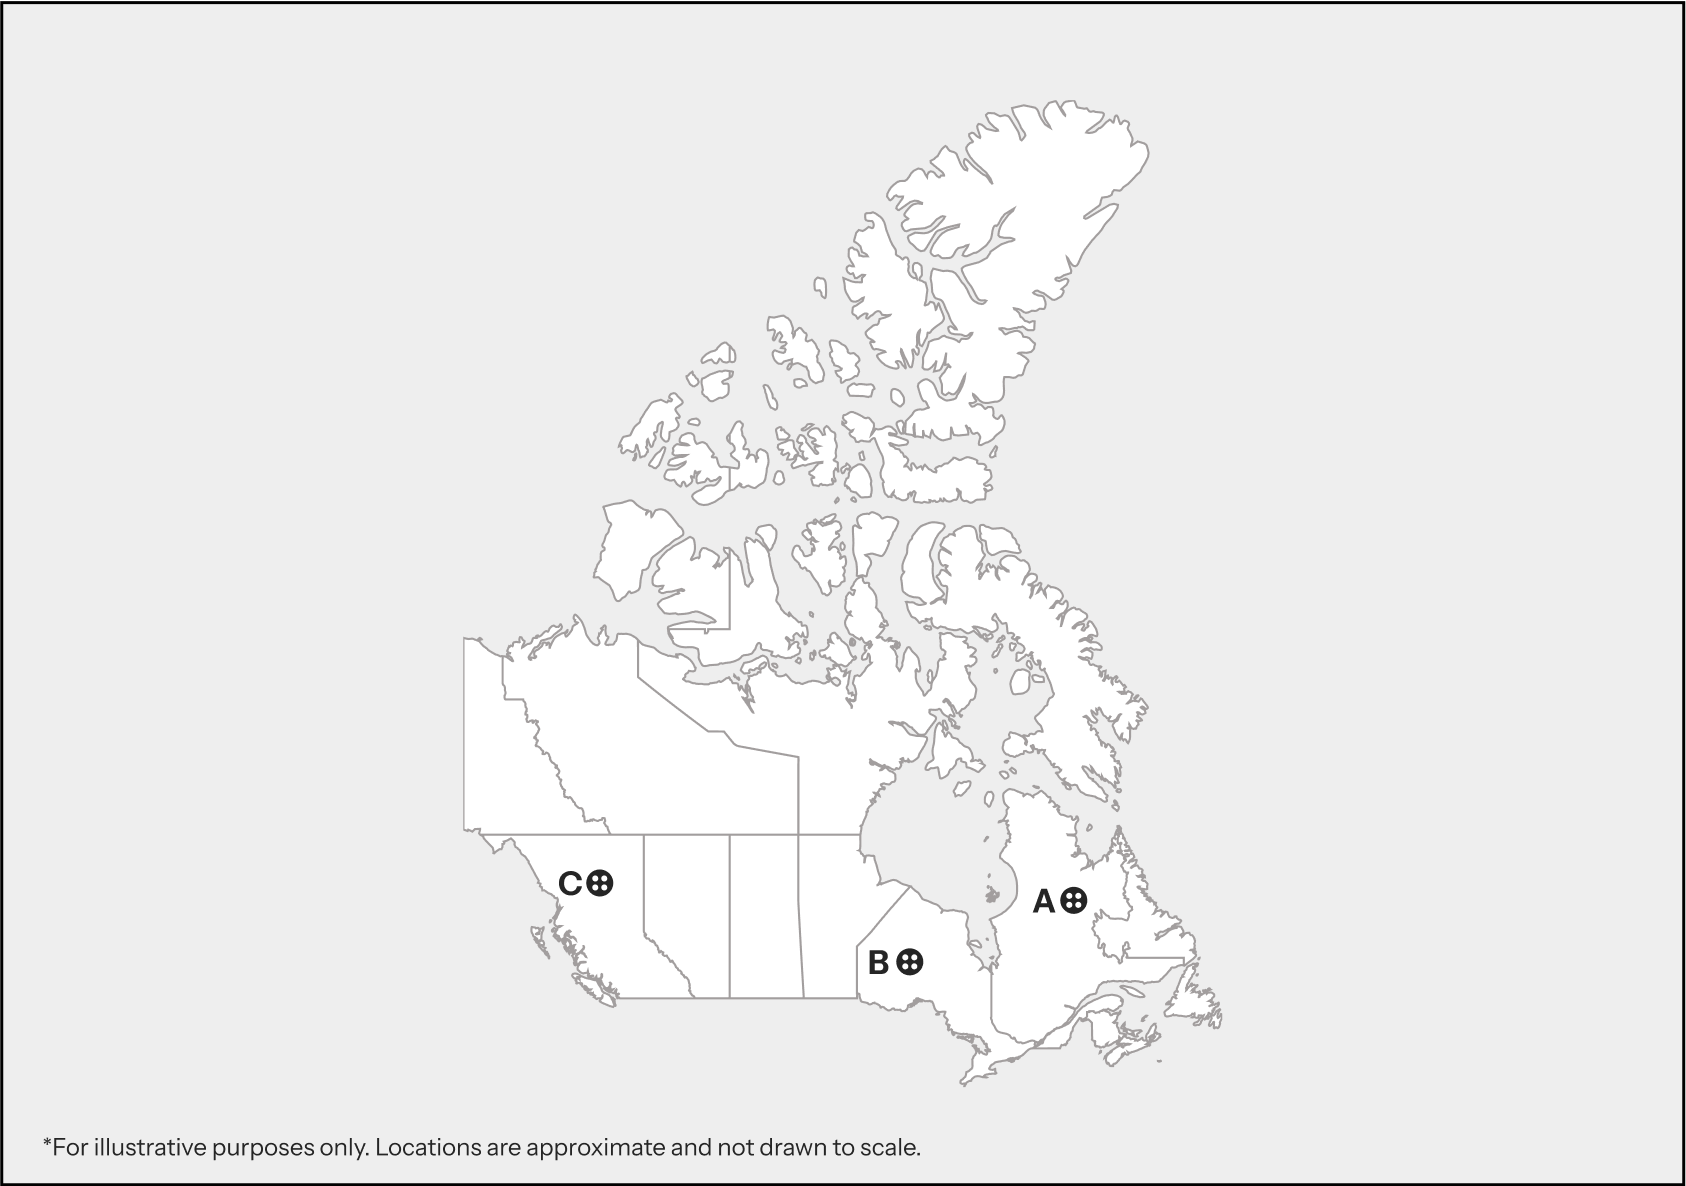
Key regions with apparel production
Quebec(A), Ontario(B) and British Columbia(C)
Other Notes
Waste regulation
Canada-Wide Action Plan for Extended Producer Responsibility (CAP-EPR, 2009)
This federal-provincial initiative sets out a framework for shifting the responsibility of managing products at end-of-life from municipalities to producers. It encompasses several product categories, and under Phase 2, textiles and carpets are identified for inclusion. However, as of now, no active nationwide EPR program for textiles exists.
Federal Consultations: Roadmap to Address Plastic Waste in the Textile and Apparel Sector (2024)
The Canadian government launched consultations to create a national roadmap addressing plastic and textile waste. The plan emphasizes redesign, reduction, reuse, repair, and recycling, aiming to accelerate the shift toward a circular textile economy.
Waste trade
91.25 kT
Import quantities (HS 6309, 631010)
114.93 kT
Export quantities (HS 6309, 631010)
Other Notes
-
green energy
23.84%
Share of modern renewables in final energy consumption
Other Notes
- Renewable Electricity Generation by source: Hydro (88.4%), Solar (27.7%), Wind (9.9%), Solar PV (1.7%)
- Canada’s Clean Technology ITC: It offers tax credits for investments in clean technologies such as wind, hydro, solar, geothermal, heat pumps, and zero-emission vehicles. Eligible properties must be acquired between March 28, 2023, and 2035, with credit rates of 30% (2023–2033) and 15% (2034). The credit applies only to clean technology assets owned and operated in Canada by taxable Canadian corporations.

